Benchmarking Data Analytics Performance for US E-commerce in 2025

Benchmarking your data analytics performance for US e-commerce in 2025 is essential for identifying strategic advantages and optimizing operational efficiency in a highly competitive digital landscape.
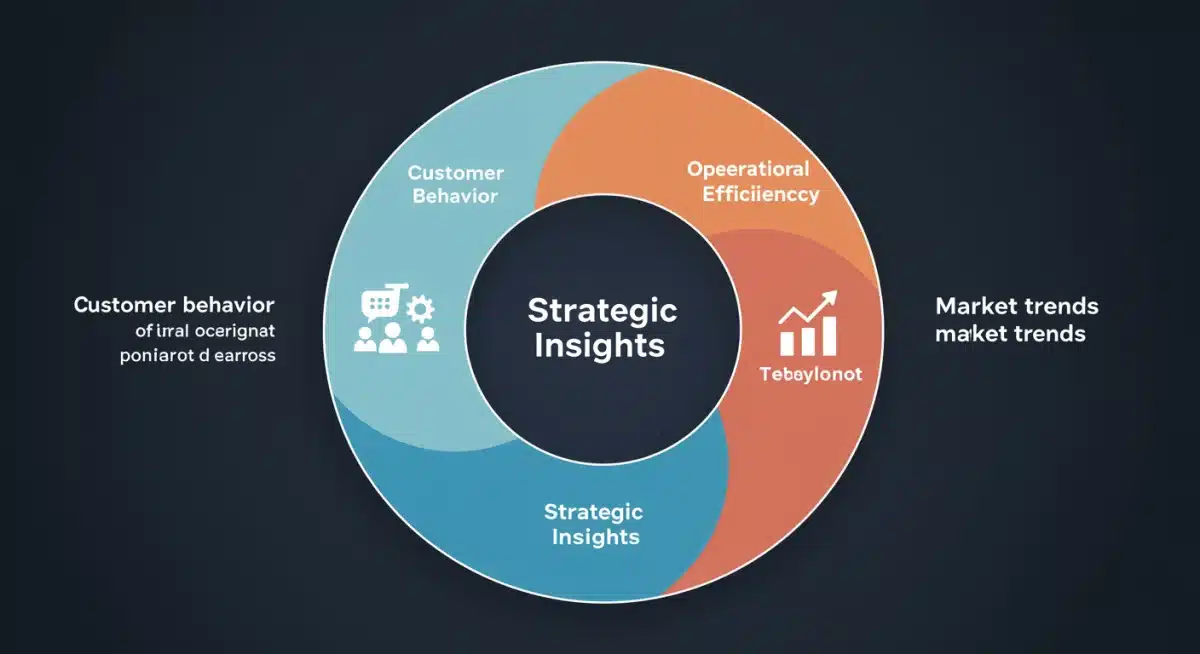
In the dynamic world of online retail, understanding where your business stands is paramount. This guide on Benchmarking Your Data Analytics Performance: A 2025 Guide for US E-commerce with 10 Key Metrics offers US e-commerce businesses a vital framework to assess and elevate their digital strategies.
The Imperative of Data Analytics Benchmarking in 2025
E-commerce in the United States is more competitive than ever, with consumer expectations constantly evolving. To thrive, businesses must move beyond simply collecting data to actively benchmarking their analytics performance against industry standards and top competitors. This proactive approach helps identify gaps, uncover growth opportunities, and validate strategic decisions.
Benchmarking provides a clear perspective on what’s working and what isn’t, preventing companies from operating in a vacuum. It allows for a data-driven comparison, moving subjective assumptions to objective realities. Without proper benchmarking, even robust analytics systems can fail to deliver their full potential, leaving valuable insights untapped.
Why Benchmarking is Non-Negotiable
In 2025, the sheer volume of data available to e-commerce businesses can be overwhelming. Benchmarking acts as a compass, guiding businesses through this data deluge. It transforms raw numbers into actionable intelligence, enabling swift adjustments to marketing, sales, and operational strategies.
- Identifies Performance Gaps: Pinpoints areas where your business lags behind competitors.
- Uncovers Best Practices: Reveals what successful rivals are doing well.
- Informs Strategic Planning: Provides data-backed insights for future growth initiatives.
- Optimizes Resource Allocation: Ensures investments are directed to areas with the highest ROI potential.
Ultimately, a robust benchmarking strategy ensures your e-commerce operations are not just performing, but outperforming. It’s about leveraging data not just to react, but to anticipate and shape market trends, securing a stronger position in the competitive US e-commerce landscape.
Key Metric 1: Customer Lifetime Value (CLTV)
Customer Lifetime Value (CLTV) is a crucial metric for any e-commerce business, representing the total revenue a business can reasonably expect from a single customer account over their relationship with the company. For US e-commerce in 2025, understanding and optimizing CLTV is more important than ever, as customer acquisition costs continue to rise.
Benchmarking your CLTV involves comparing your average customer value against industry averages for similar e-commerce sectors and against your top competitors, if possible. A higher CLTV indicates successful customer retention and satisfaction strategies, suggesting that your product, service, and overall customer experience resonate deeply with your audience. Conversely, a low CLTV signals potential issues in customer loyalty or product value perception.
Calculating and Enhancing CLTV
The calculation of CLTV can vary in complexity, but a common approach involves multiplying the average purchase value by the average purchase frequency, and then by the average customer lifespan. This provides a foundational understanding of the long-term value each customer brings.
- Improve Customer Retention: Implement loyalty programs, personalized communication, and exceptional customer service.
- Increase Average Order Value (AOV): Encourage larger purchases through upselling, cross-selling, and bundling products.
- Boost Purchase Frequency: Engage customers with relevant promotions, new product announcements, and re-engagement campaigns.
By focusing on these areas and continuously benchmarking your CLTV, US e-commerce businesses can build more sustainable growth models, fostering long-term relationships with their customer base rather than solely focusing on one-time transactions.
Key Metric 2: Conversion Rate (CR)
The conversion rate (CR) is arguably one of the most direct indicators of an e-commerce website’s effectiveness. It measures the percentage of website visitors who complete a desired action, most commonly making a purchase. For US e-commerce businesses in 2025, a healthy conversion rate signifies that your website design, product offerings, pricing, and overall user experience are optimized to meet customer needs and drive sales.
Benchmarking your conversion rate involves comparing it against industry averages for your specific e-commerce niche. Conversion rates can vary significantly across different product categories, so it’s essential to compare apples to apples. A low conversion rate, even with high traffic, suggests potential friction points in the customer journey that need immediate attention.
Optimizing Your Conversion Funnel
Improving conversion rates often involves a systematic review and optimization of the entire customer journey, from initial landing page to checkout. Small adjustments in design, copy, or functionality can yield significant improvements.
- Streamline Checkout Process: Reduce steps, offer guest checkout, and ensure mobile responsiveness.
- Enhance Product Pages: Use high-quality images, detailed descriptions, and customer reviews.
- Improve Site Speed: Fast loading times are critical for user experience and SEO.
- Personalize User Experience: Tailor content and product recommendations based on browsing history.
Regular A/B testing of different elements on your site is crucial for identifying what resonates best with your audience. By continuously refining your conversion funnel based on data and benchmarking against successful peers, US e-commerce businesses can significantly boost their sales efficiency.
Key Metric 3: Average Order Value (AOV)
Average Order Value (AOV) represents the average amount of money a customer spends per transaction on your e-commerce store. This metric is vital for understanding the profitability of your marketing and sales efforts. For US e-commerce businesses, increasing AOV is a powerful strategy to boost revenue without necessarily increasing traffic or conversion rates.
Benchmarking your AOV against industry standards helps you understand if your pricing strategies, product bundling, and promotional efforts are competitive. If your AOV is significantly lower than competitors, it might indicate missed opportunities for upselling or cross-selling, or perhaps a need to re-evaluate your product offerings and pricing tiers.
Strategies to Elevate AOV
There are several proven tactics e-commerce businesses can employ to encourage customers to spend more per purchase. These strategies often focus on providing added value or convenience.
- Upselling and Cross-selling: Suggest higher-priced alternatives or complementary products at checkout.
- Product Bundling: Offer discounts for purchasing multiple related items together.
- Minimum Spend for Free Shipping: Incentivize customers to add more items to their cart to qualify for free delivery.
- Quantity Discounts: Provide price breaks for buying larger quantities of a single item.
By strategically implementing these methods and continuously monitoring your AOV in relation to benchmarks, US e-commerce businesses can maximize the revenue generated from each customer interaction, leading to healthier profit margins and more efficient growth.
Key Metric 4: Customer Acquisition Cost (CAC)
Customer Acquisition Cost (CAC) measures the total cost associated with convincing a prospective customer to buy a product or service. This includes all marketing and sales expenses divided by the number of new customers acquired over a specific period. For US e-commerce, where advertising costs can be substantial, a clear understanding of CAC is paramount for sustainable growth.
Benchmarking your CAC against industry averages is crucial. If your CAC is significantly higher than your competitors’, it suggests inefficiencies in your marketing campaigns or targeting. Conversely, a lower CAC could indicate highly effective marketing strategies or a strong brand reputation that naturally attracts customers.
Optimizing CAC for Efficiency
Reducing CAC without compromising customer quality requires a strategic approach to marketing and sales. It involves optimizing various touchpoints in the customer journey to ensure maximum impact for every dollar spent.
- Refine Targeting: Focus on demographics and psychographics most likely to convert.
- Optimize Ad Spend: Continuously test and adjust ad campaigns for better ROI across platforms.
- Leverage Organic Channels: Invest in SEO, content marketing, and social media to reduce reliance on paid ads.
- Improve Conversion Rates: A higher conversion rate means more customers from the same marketing spend, effectively lowering CAC.
By diligently tracking and benchmarking CAC, US e-commerce businesses can ensure their growth is not only rapid but also profitable. It helps in making informed decisions about allocating marketing budgets and identifying the most cost-effective channels for customer acquisition.
Key Metric 5: Return on Ad Spend (ROAS)
Return on Ad Spend (ROAS) is a vital metric for evaluating the effectiveness of your advertising campaigns. It measures the revenue generated for every dollar spent on advertising. In the competitive US e-commerce landscape of 2025, where digital advertising is a major expense, a strong ROAS is indicative of profitable marketing investments and efficient campaign management.
Benchmarking your ROAS against industry standards provides critical insight into whether your advertising efforts are delivering competitive results. A ROAS that falls below industry benchmarks may signal that your ad creatives, targeting, bidding strategies, or landing page experiences need significant improvement. Conversely, a high ROAS suggests effective campaign execution and a strong return on your marketing budget.
Maximizing Your ROAS
Improving ROAS involves a continuous cycle of testing, analysis, and optimization across all advertising channels. It requires a deep understanding of your audience and how they interact with your ads.
- Granular Audience Targeting: Ensure your ads reach the most relevant potential customers.
- Compelling Ad Creatives: Develop engaging visuals and persuasive copy that resonates.
- Optimized Landing Pages: Ensure post-click experiences are seamless and encourage conversion.
- A/B Testing: Continuously experiment with different ad elements to identify top performers.
By meticulously tracking and benchmarking ROAS, US e-commerce businesses can fine-tune their advertising strategies, ensuring every marketing dollar contributes meaningfully to revenue growth and maintaining a competitive edge in the crowded digital marketplace.
Key Metric 6: Cart Abandonment Rate
The cart abandonment rate represents the percentage of online shoppers who add items to their shopping cart but do not complete the purchase. This metric is a significant indicator of potential revenue loss for US e-commerce businesses. A high abandonment rate suggests obstacles or hesitations in the final stages of the customer journey, preventing conversion.
Benchmarking your cart abandonment rate against industry averages is crucial for identifying if your checkout process is meeting customer expectations. Rates can vary by industry, but generally, a lower abandonment rate indicates a smoother, more trustworthy, and user-friendly checkout experience. A rate significantly above the benchmark necessitates immediate investigation and optimization.
Reducing Cart Abandonment
Addressing cart abandonment requires a multi-faceted approach, focusing on transparency, convenience, and reassurance throughout the checkout process. Even minor improvements can lead to substantial gains in completed purchases.
- Transparent Costs: Disclose all costs, including shipping and taxes, upfront.
- Simplified Checkout: Minimize the number of steps and form fields required.
- Multiple Payment Options: Offer a variety of trusted payment methods.
- Exit-Intent Pop-ups: Provide last-minute incentives or reminders for abandoning users.
- Retargeting Campaigns: Send email or ad reminders to users who left items in their cart.
By actively monitoring and benchmarking your cart abandonment rate, US e-commerce businesses can systematically eliminate friction points, convert more browsers into buyers, and recover a significant portion of potentially lost revenue.
Key Metric 7: Website Speed and Performance
Website speed and performance are foundational to a positive user experience and directly impact conversion rates and SEO rankings. In 2025, US e-commerce consumers expect instant gratification; slow loading times can lead to immediate abandonment. This metric encompasses page load times, server response times, and overall site responsiveness.
Benchmarking your website’s speed against competitors and Google’s recommended core web vitals is essential. Tools like Google PageSpeed Insights offer valuable data for comparison. A slow-performing site, even with excellent products, will struggle to convert and retain customers, putting it at a significant disadvantage in the fast-paced e-commerce environment.
Enhancing Site Performance
Optimizing website speed involves technical adjustments and ongoing maintenance. Prioritizing these improvements can yield substantial returns in user satisfaction and business metrics.
- Image Optimization: Compress images without sacrificing quality.
- Leverage Caching: Store static versions of your site to load faster for returning visitors.
- Minimize Code: Reduce CSS, JavaScript, and HTML file sizes.
- Choose a Reliable Host: A high-quality hosting provider is fundamental for fast server response times.
- Content Delivery Network (CDN): Use a CDN to deliver content quickly to users based on their geographical location.
Consistent monitoring and benchmarking of your website’s performance ensure that your e-commerce platform remains agile and responsive, providing a seamless shopping experience that encourages engagement and conversions for your US customer base.
Key Metric 8: Mobile Conversion Rate
With the increasing prevalence of smartphone shopping, the mobile conversion rate is a critical metric for US e-commerce businesses in 2025. This metric specifically measures the percentage of mobile users who complete a desired action, such as a purchase, on your website. A strong mobile conversion rate indicates a successful mobile-first design and a user experience optimized for smaller screens.
Benchmarking your mobile conversion rate against industry averages is vital, as mobile shopping trends continue to grow. If your mobile conversion rate significantly trails your desktop rate or industry benchmarks, it highlights specific issues with your mobile site’s usability, navigation, or checkout process that need immediate attention. Ignoring mobile performance means missing out on a massive segment of the market.
Optimizing for Mobile Success
Achieving a high mobile conversion rate requires a dedicated focus on the mobile user experience. Every element, from product display to payment options, must be designed with mobile users in mind.
- Responsive Design: Ensure your website adapts flawlessly to all screen sizes.
- Simplified Navigation: Use clear menus and easy-to-tap buttons.
- Fast Mobile Load Times: Mobile users are even less patient than desktop users.
- Mobile-Friendly Checkout: Streamline forms and offer mobile payment options like Apple Pay or Google Pay.
- Finger-Friendly Elements: Ensure buttons and links are adequately sized and spaced.
By meticulously optimizing and benchmarking your mobile conversion rate, US e-commerce businesses can capture the growing mobile market effectively, providing a frictionless shopping experience that drives sales and customer loyalty.
Key Metric 9: Customer Retention Rate
The customer retention rate measures the percentage of existing customers who continue to purchase from your business over a specific period. In the competitive US e-commerce landscape, retaining existing customers is often more cost-effective than acquiring new ones. A high retention rate signifies strong customer satisfaction, brand loyalty, and effective post-purchase engagement strategies.
Benchmarking your customer retention rate against industry averages provides insight into the effectiveness of your customer loyalty programs, customer service, and overall post-purchase experience. A low retention rate might indicate issues with product quality, customer support, or a lack of ongoing engagement with your customer base. Understanding this metric is key to building a sustainable business.
Strategies for Boosting Retention
Improving customer retention involves nurturing relationships and ensuring customers feel valued long after their initial purchase. It’s about building a community around your brand.
- Exceptional Customer Service: Prompt and helpful support builds trust.
- Loyalty Programs: Reward repeat purchases and engagement.
- Personalized Communication: Send relevant emails and offers based on past behavior.
- Post-Purchase Follow-ups: Solicit feedback and offer assistance.
- Exclusive Content/Offers: Make loyal customers feel special.
By focusing on strategies that enhance customer satisfaction and loyalty, and consistently benchmarking your retention rate, US e-commerce businesses can cultivate a loyal customer base, leading to predictable revenue streams and organic growth through word-of-mouth referrals.
Key Metric 10: Inventory Turnover Rate
The inventory turnover rate is an operational metric that indicates how many times a company has sold and replaced its inventory during a specific period. For US e-commerce businesses, efficient inventory management is crucial for profitability, as holding excess stock incurs costs, while too little stock can lead to missed sales. A healthy turnover rate balances supply and demand effectively.
Benchmarking your inventory turnover rate against industry standards helps assess the efficiency of your supply chain and sales operations. A high turnover rate generally indicates strong sales and efficient inventory management, while a low rate can signal overstocking, low demand, or inefficient sales. This metric is particularly important for businesses dealing with perishable goods or fast-moving trends.
Optimizing Inventory Turnover
Improving inventory turnover involves a blend of forecasting accuracy, strategic purchasing, and effective sales. The goal is to minimize holding costs while maximizing sales opportunities.
- Accurate Demand Forecasting: Use data analytics to predict future sales trends.
- Just-in-Time Inventory: Minimize stock on hand by receiving goods only as they are needed.
- Optimize Pricing Strategies: Use dynamic pricing to move slow-selling items.
- Supplier Relationship Management: Ensure reliable and flexible supplier relationships.
- Reduce Lead Times: Work with suppliers to shorten the time from order to delivery.
By diligently tracking and benchmarking your inventory turnover rate, US e-commerce businesses can optimize their operational efficiency, reduce carrying costs, and ensure they always have the right products in stock to meet customer demand without excess waste.
| Key Metric | Brief Description |
|---|---|
| Customer Lifetime Value (CLTV) | Total revenue expected from a customer over their relationship. |
| Conversion Rate (CR) | Percentage of website visitors completing a desired action (e.g., purchase). |
| Average Order Value (AOV) | Average amount spent by a customer per transaction. |
| Return on Ad Spend (ROAS) | Revenue generated for every dollar spent on advertising. |
Frequently Asked Questions About E-commerce Analytics Benchmarking
Benchmarking is crucial for US e-commerce businesses in 2025 because it provides objective insights into performance against industry standards and competitors. This helps identify strengths, weaknesses, and areas for strategic improvement, ensuring businesses remain competitive and adapt to evolving market demands.
Ideally, e-commerce businesses should benchmark their data analytics performance quarterly or semi-annually. This frequency allows for sufficient data accumulation to identify trends and assess the impact of implemented strategies, while also being frequent enough to make timely adjustments in a fast-paced market.
Key challenges include accessing reliable industry data for comparison, ensuring data accuracy and consistency across different platforms, and correctly interpreting benchmarks in the context of your specific business model. It also involves selecting the most relevant metrics for your unique operational goals.
Yes, small e-commerce businesses can absolutely benchmark their performance. While they might have fewer resources, focusing on a few critical metrics and leveraging publicly available industry reports or free analytics tools can provide valuable insights for growth and competitive positioning.
Benchmarking significantly impacts e-commerce strategy by providing a data-driven foundation for decision-making. It helps prioritize investments, refine marketing campaigns, optimize user experience, and ultimately align business goals with market realities, leading to more effective and profitable outcomes.
Conclusion
In the highly competitive and ever-evolving US e-commerce landscape of 2025, robust data analytics benchmarking is no longer a luxury but a fundamental necessity for sustained success. By meticulously tracking and comparing key metrics such as CLTV, conversion rates, AOV, CAC, ROAS, cart abandonment, website speed, mobile conversion, customer retention, and inventory turnover, businesses can gain unparalleled insights into their performance relative to industry standards and top competitors. This strategic approach empowers online retailers to identify critical areas for improvement, optimize their digital strategies, and allocate resources more effectively. Ultimately, a commitment to continuous benchmarking ensures that US e-commerce businesses are not just participating in the market, but actively shaping their future with data-driven precision, securing a stronger, more profitable position in the years to come.


